@aicore/metrics
Metrics library for all core.ai services. A lightweight, efficient metrics reporting library for JavaScript
applications that provides a simple interface to collect and send various metrics to a monitoring service endpoint.
Code Guardian


Features
- Count event metrics for tracking occurrences
- Value event metrics for tracking specific data points over time
- Automatic batching and sending of metrics at configurable intervals
- Throttling to prevent overwhelming the metrics service
- Automatic retry on failed sends with backoff
- Small footprint with minimal dependencies
Installation
npm install @aicore/metrics
Quick Start
import { init, countEvent, valueEvent } from '@aicore/metrics';
init('my-app', "dev", 'http://metrics.example.com/ingest', 'api-key-123');
countEvent('page_view', 'frontend', 'homepage');
countEvent('user', 'action', 'pasteCount', 5);
valueEvent('response_time', 'api', 'get_user', 135);
API Reference
init
Initializes the monitoring client.
This function must be called before using any other monitoring functions.
The client can only be initialized once per application lifecycle.
Parameters
serviceName [string][1] Unique name of the service being monitoredstage [string][1] The stage of the service. Eg: dev, prod, staging, etc..metricsEndpointDomain [string][1] Domain where metrics will be sent. Eg. metrics.your-cloud.ioapiKey [string][1] Authentication key for the metrics service
Examples
default('my-app', "dev", 'http://metrics.example.com/ingest', 'api-key-123');
- Throws [Error][2] If the client has already been initialized or if any parameter is invalid
countEvent
Records a metric event with the specified parameters.
The client must be initialized with init() before calling this function.
Metrics are batched and sent at regular intervals.
Parameters
category [string][1] Primary category for the metricsubCategory [string][1] Secondary category for the metriclabel [string][1] label for additional classificationcount [number][3] Value to increment the metric by, defaults to 1 (optional, default 1)
Examples
countEvent('page_view', 'frontend', 'homepage');
countEvent('downloads', 'content', 'pdf', 5);
- Throws [Error][2] If the client has not been initialized
Returns [boolean][4] true if the metric was recorded, false if it was dropped
valueEvent
Records a value metric with the specified parameters.
Unlike countEvent, valueEvent records each value with its own timestamp without aggregation.
The client must be initialized with init() before calling this function.
Limited to MAX_VALUES_PER_INTERVAL values per metric key per interval.
Parameters
category [string][1] Primary category for the metricsubCategory [string][1] Secondary category for the metriclabel [string][1] label for additional classificationvalue ([number][3] | [string][1]) The value to record
Examples
valueEvent('temperature', 'sensors', 'outdoor', 22.5);
- Throws [Error][2] If the client has not been initialized
Returns [boolean][4] true if the metric was recorded, false if it was dropped
flush
Manually sends all collected metrics immediately without waiting for the interval.
This is useful for sending metrics before application shutdown or when immediate reporting is needed.
The client must be initialized with init() before calling this function.
Examples
await flush();
console.log('All metrics have been sent');
- Throws [Error][2] If the client has not been initialized
Returns [Promise][5] A promise that resolves when the metrics have been sent, or rejects if sending fails
System Monitoring
The metrics library includes built-in system monitoring capabilities that automatically track essential system metrics when initialized.
The following metrics are automatically collected:
- CPU: Core count, load averages, CPU utilization percentages
- Memory: Total/free/used memory, heap usage, memory percentage metrics
- Disk: Storage usage, available space etc.
- Process: Uptime, active handles, file descriptors...
- Event Loop: Performance metrics including mean/max/min delay times
Using System Metrics in Your Application
You can use the SYSTEM_CATEGORY constant to tag your own metrics related to system resources for a specific host.
This ensures metrics are properly attributed to the specific host:
import { valueEvent, SYSTEM_CATEGORY } from '@aicore/metrics';
valueEvent(SYSTEM_CATEGORY, 'custom', 'my_metric', 42.5);
All system metrics are automatically tagged with host information for proper identification in your monitoring dashboards.
Advanced Usage
Monitoring Client Class
For advanced use cases, you can directly use the MonitoringClient class:
import { MonitoringClient } from '@core/monitoring-client';
const client = new MonitoringClient('my-service', 'prod', 'http://metrics.example.com/ingest', 'api-key-123');
const metrics = [
`my-service{metric="custom_metric",category="test",subCategory="example"} 1 ${Date.now()}`
];
client.sendMetrics(metrics)
.then(result => console.log('Metrics sent successfully', result))
.catch(error => console.error('Failed to send metrics', error));
QuestDB Backend Integration
This library has been optimized to work with QuestDB as the backend time-series database, providing high-performance metrics storage and querying capabilities.
Production Deployment Architecture
The recommended production setup uses NGINX as a reverse proxy for authentication, SSL termination, and rate limiting:
Client → NGINX (SSL + Auth) → QuestDB → Grafana (Visualization)
Benefits of NGINX Integration:
- Bearer Token Authentication: Secure API key-based access to metrics ingestion
- SSL Termination: HTTPS support with automatic Let's Encrypt certificates
- Rate Limiting: Protection against API abuse and DDoS attacks
- PAM Authentication: Unix system user authentication for admin access
- High Performance: Optimized proxy configuration with connection pooling
Metrics Ingestion Endpoint
When using the complete monitoring stack, metrics are sent through NGINX:
default('my-service', 'prod', 'https://metrics.yourdomain.com/ingest', 'your-bearer-token');
Authentication: Uses Bearer token authentication configured during stack installation. The token is automatically generated and configured in NGINX for the /ingest endpoint.
Complete Documentation
For detailed configuration and operational guidance, refer to the comprehensive documentation included with the monitoring stack:
- NGINX Configuration Guide: Complete NGINX setup, performance optimizations, SSL configuration, and troubleshooting
- QuestDB Configuration Guide: Database optimization, schema design, performance tuning, and operational procedures
These guides provide production-ready configurations and best practices for enterprise deployments.
⚠️ Required Schema Setup
IMPORTANT: Before using this library with QuestDB, you must create the optimized metrics table schema to prevent performance issues from auto-creation with default settings.
Why Schema Setup is Required
QuestDB automatically creates tables when receiving InfluxDB Line Protocol data, but uses default SYMBOL capacities of only 256, which causes performance degradation as your metrics scale. Creating the schema beforehand ensures optimal performance.
Quick Setup with QuestDB Monitoring Stack
If you're using the complete QuestDB monitoring stack, the schema is automatically created during installation:
git clone https://github.com/aicore/quest.git && cd quest/
sudo ./setup-production.sh --ssl
sudo ./setup-production.sh
Manual Schema Creation
For existing QuestDB installations, create the schema manually before sending any metrics:
curl -G "http://questdb:9000/exec" --data-urlencode "query=CREATE TABLE IF NOT EXISTS metrics (
timestamp TIMESTAMP,
service SYMBOL CAPACITY 50000,
stage SYMBOL CAPACITY 1000,
metric_type SYMBOL CAPACITY 1000,
category SYMBOL CAPACITY 10000,
subcategory SYMBOL CAPACITY 10000,
label VARCHAR,
host SYMBOL CAPACITY 100000,
value DOUBLE
) timestamp(timestamp) PARTITION BY DAY WAL;"
Data Format
Metrics are automatically converted to InfluxDB Line Protocol format and stored in QuestDB with the following optimized schema:
CREATE TABLE metrics (
timestamp TIMESTAMP,
service SYMBOL CAPACITY 50000,
stage SYMBOL CAPACITY 1000,
metric_type SYMBOL CAPACITY 1000,
category SYMBOL CAPACITY 10000,
subcategory SYMBOL CAPACITY 10000,
label VARCHAR,
host SYMBOL CAPACITY 100000,
value DOUBLE
) timestamp(timestamp) PARTITION BY DAY WAL;
Performance Characteristics
- Sub-millisecond Queries: Service, stage, metric_type, category, and subcategory filtering uses SYMBOL optimization (integer comparison)
- High-Performance Ingestion: Supports >1 million metrics per second with optimized batching
- Efficient Storage: 10x compression vs traditional databases with columnar storage
- Scalable Filtering: Host filtering optimized for 100,000+ unique hosts/containers
- Time-Series Optimized: Daily partitioning with automatic query optimization
- Memory Efficient: SYMBOL columns provide significant memory savings for repeated values
Grafana Integration
The single-table design enables powerful Grafana dashboards and alerting with simple SQL queries.
Dashboard Examples
Service Performance Monitoring
SELECT timestamp, service, avg(value) as response_time
FROM metrics
WHERE category = 'response_time'
AND metric_type = 'value'
AND $__timeFilter(timestamp)
GROUP BY timestamp, service
ORDER BY timestamp;
SELECT timestamp, service, sum(value) as requests
FROM metrics
WHERE category = 'http_request'
AND metric_type = 'count'
AND $__timeFilter(timestamp)
GROUP BY timestamp, service
ORDER BY timestamp;
Infrastructure Monitoring
SELECT timestamp, host, avg(value) as cpu_percent
FROM metrics
WHERE category = 'system'
AND subcategory = 'cpu'
AND label = 'usage_percent'
AND $__timeFilter(timestamp)
GROUP BY timestamp, host
ORDER BY timestamp;
SELECT timestamp, host, avg(value) as memory_percent
FROM metrics
WHERE category = 'system'
AND subcategory = 'memory'
AND label = 'usage_percent'
AND $__timeFilter(timestamp)
GROUP BY timestamp, host
ORDER BY timestamp;
Dashboard Variables (Dropdowns)
SELECT DISTINCT service FROM metrics WHERE $__timeFilter(timestamp);
SELECT DISTINCT stage FROM metrics WHERE $__timeFilter(timestamp);
SELECT DISTINCT host FROM metrics WHERE $__timeFilter(timestamp);
Alerting Rules
High Error Rate Alert
SELECT service, avg(value) as error_rate
FROM metrics
WHERE category = 'error_rate'
AND timestamp > now() - 5m
GROUP BY service
HAVING avg(value) > 5;
High Latency Alert
SELECT service, subcategory, avg(value) as avg_response_time
FROM metrics
WHERE category = 'response_time'
AND timestamp > now() - 5m
GROUP BY service, subcategory
HAVING avg(value) > 1000;
Service Health Check
SELECT service, count(*) as metric_count
FROM metrics
WHERE timestamp > now() - 5m
GROUP BY service
HAVING count(*) = 0;
Limitations and Best Practices
⚠️ Schema Setup Requirement
CRITICAL: The optimized QuestDB schema must be created before sending any metrics data. See the Required Schema Setup section above. Using the library without proper schema setup will result in:
- Poor performance due to default 256 SYMBOL capacities
- Hash collisions and slower queries
- Potential data ingestion slowdowns at scale
SYMBOL Column Limitations
- Service names: Limited to 50,000 unique values
- Stages: Limited to 1,000 unique values
- Metric types: Limited to 1,000 unique values
- Categories: Limited to 10,000 unique values
- Subcategories: Limited to 10,000 unique values
- Host names: Limited to 100,000 unique values
- Cannot resize SYMBOL capacity after table creation
Performance Guidelines
- Normalize high-cardinality labels to avoid unnecessary uniqueness
- Monitor SYMBOL table utilization in production
- Use consistent service naming conventions
- Optimal partition size: 1-100 million records per day
Data Retention
- Data deletion only available at partition level (daily)
- Plan retention policies according to daily partitions
- Individual record deletion not supported
Schema Evolution
- Tables cannot be repartitioned after creation
- Schema changes require table recreation and data migration
- Plan column additions carefully
Development
Requirements
- Node.js (latest LTS recommended)
- npm (latest stable version recommended)
Setup
git clone https://github.com/aicore/metrics.git
cd metrics
npm install
Testing
npm run test:unit
export METRICS_ENDPOINT=http://your-metrics-server/ingest
export METRICS_API_KEY=your-api-key
npm run test:integ
npm run test
npm run cover:unit
Building and Documentation
npm run build
npm run createJSDocs
Commands available
Building
Since this is a pure JS template project, build command just runs test with coverage.
> npm install   // do this only once.
> npm run build
Linting
To lint the files in the project, run the following command:
> npm run lint
To Automatically fix lint errors:
> npm run lint:fix
Testing
To run all tests:
> npm run test
  Hello world Tests
    ✔ should return Hello World
    #indexOf()
      ✔ should return -1 when the value is not present
Additionally, to run unit/integration tests only, use the commands:
> npm run test:unit
> npm run test:integ
Coverage Reports
To run all tests with coverage:
> npm run cover
  Hello world Tests
    ✔ should return Hello World
    #indexOf()
      ✔ should return -1 when the value is not present


  2 passing (6ms)

----------|---------|----------|---------|---------|-------------------
File      | % Stmts | % Branch | % Funcs | % Lines | Uncovered Line #s
----------|---------|----------|---------|---------|-------------------
All files |     100 |      100 |     100 |     100 |
 index.js |     100 |      100 |     100 |     100 |
----------|---------|----------|---------|---------|-------------------

=============================== Coverage summary ===============================
Statements   : 100% ( 5/5 )
Branches     : 100% ( 2/2 )
Functions    : 100% ( 1/1 )
Lines        : 100% ( 5/5 )
================================================================================
Detailed unit test coverage report: file:///template-nodejs/coverage-unit/index.html
Detailed integration test coverage report: file:///template-nodejs/coverage-integration/index.html
After running coverage, detailed reports can be found in the coverage folder listed in the output of coverage command.
Open the file in browser to view detailed reports.
To run unit/integration tests only with coverage
> npm run cover:unit
> npm run cover:integ
Sample coverage report:

Unit and Integration coverage configs
Unit and integration test coverage settings can be updated by configs .nycrc.unit.json and .nycrc.integration.json.
See https://github.com/istanbuljs/nyc for config options.
Publishing packages to NPM
Preparing for release
Please run npm run release on the main branch and push the changes to main. The release command will bump the npm version.
!NB: NPM publish will faill if there is another release with the same version.
Publishing
To publish a package to npm, push contents to npm branch in
this repository.
Publishing @aicore/package*
If you are looking to publish to package owned by core.ai, you will need access to the GitHub Organization secret NPM_TOKEN.
For repos managed by aicore org in GitHub, Please contact your Admin to get access to core.ai's NPM tokens.
Publishing to your own npm account
Alternatively, if you want to publish the package to your own npm account, please follow these docs:
- Create an automation access token by following this link.
- Add NPM_TOKEN to your repository secret by following this link
To edit the publishing workflow, please see file: .github/workflows/npm-publish.yml
Dependency updates
We use Rennovate for dependency updates: https://blog.logrocket.com/renovate-dependency-updates-on-steroids/
Code Guardian
Several automated workflows that check code integrity are integrated into this template.
These include:
- GitHub actions that runs build/test/coverage flows when a contributor raises a pull request
- Sonar cloud integration using
.sonarcloud.properties
- In sonar cloud, enable Automatic analysis from
Administration Analysis Method for the first time 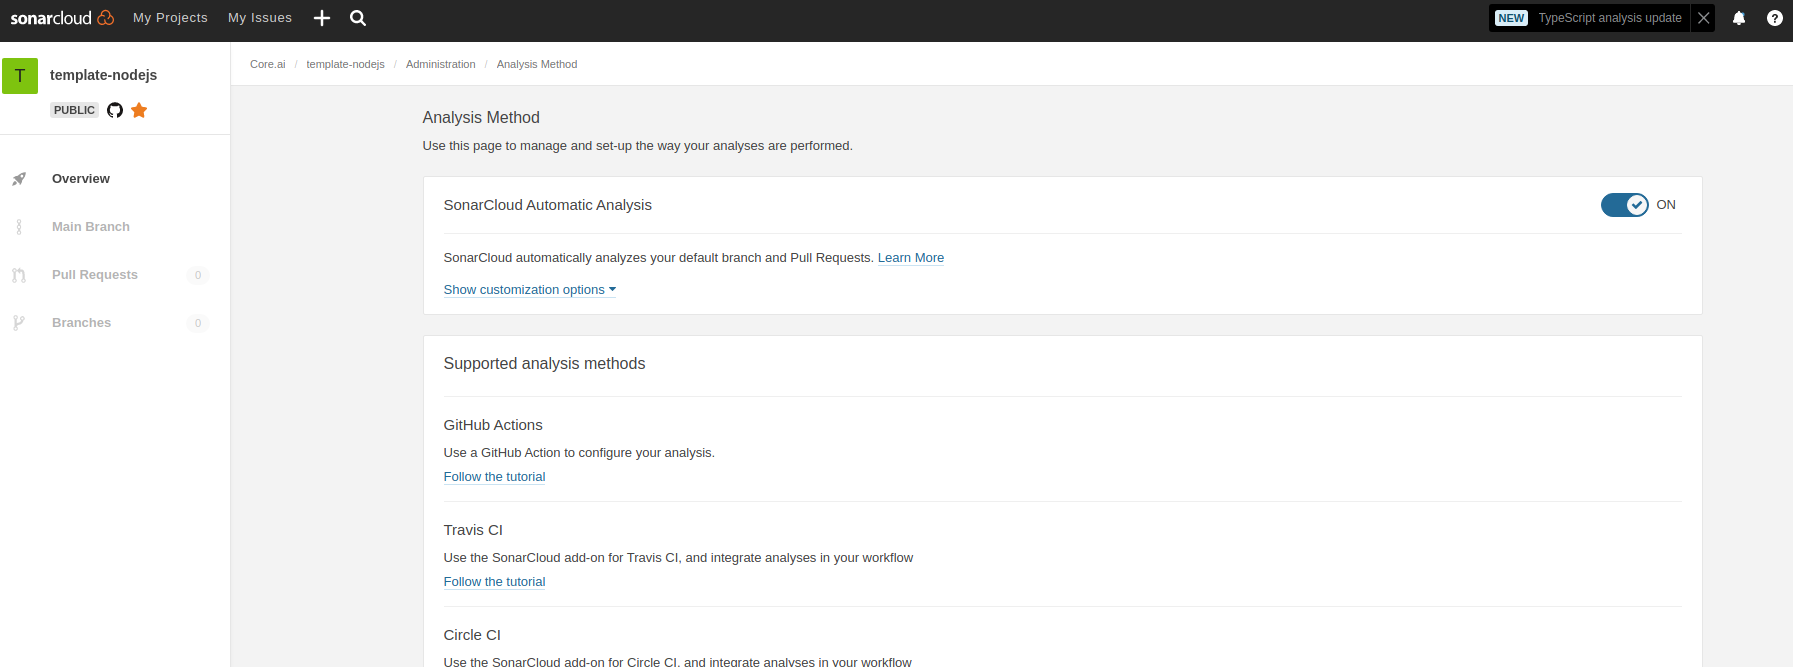
IDE setup
SonarLint is currently available as a free plugin for jetbrains, eclipse, vscode and visual studio IDEs.
Use sonarLint plugin for webstorm or any of the available
IDEs from this link before raising a pull request: https://www.sonarlint.org/ .
SonarLint static code analysis checker is not yet available as a Brackets
extension.
Internals
Testing framework: Mocha , assertion style: chai
See https://mochajs.org/#getting-started on how to write tests
Use chai for BDD style assertions (expect, should etc..). See move here: https://www.chaijs.com/guide/styles/#expect
Mocks and spies:
Since it is not that straight forward to mock es6 module imports, use the follow pull request as reference to mock
imported libs:
using sinon lib if the above method doesn't fit your case
if you want to mock/spy on fn() for unit tests, use sinon. refer docs: https://sinonjs.org/
Note on coverage suite used here:
we use c8 for coverage https://github.com/bcoe/c8. Its reporting is based on nyc, so detailed docs can be found
here: https://github.com/istanbuljs/nyc ; We didn't use nyc as it do not yet have ES module support
see: https://github.com/digitalbazaar/bedrock-test/issues/16 . c8 is drop replacement for nyc coverage reporting tool


